
Our Platform
Turning climate & risk data into measurable insurance.
HeliosRate risk intelligence platform is an end-to-end technology preview for parametric risk quotation, correlation analysis and portfolio underwriting.
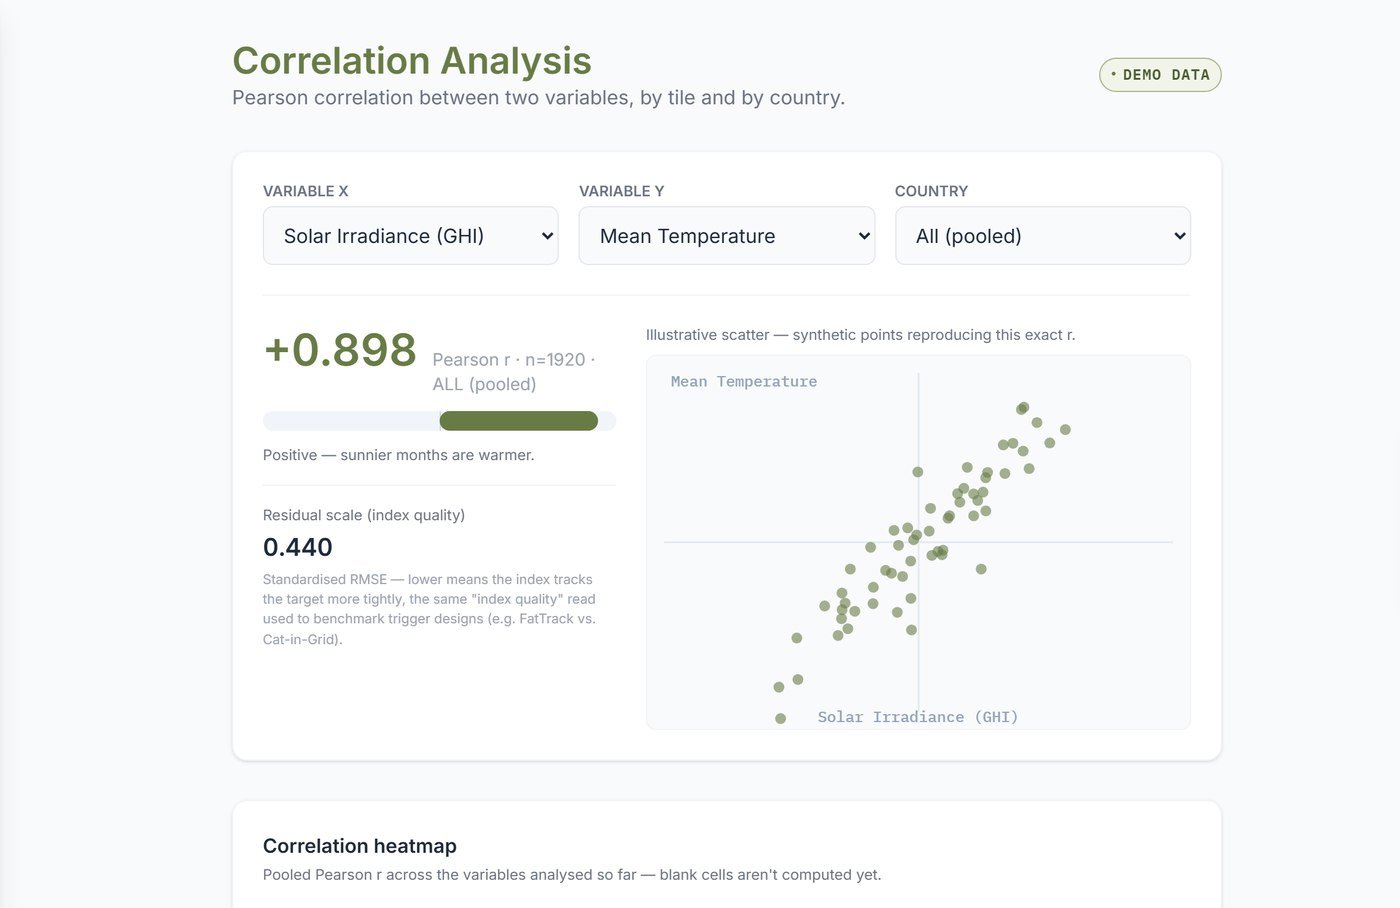
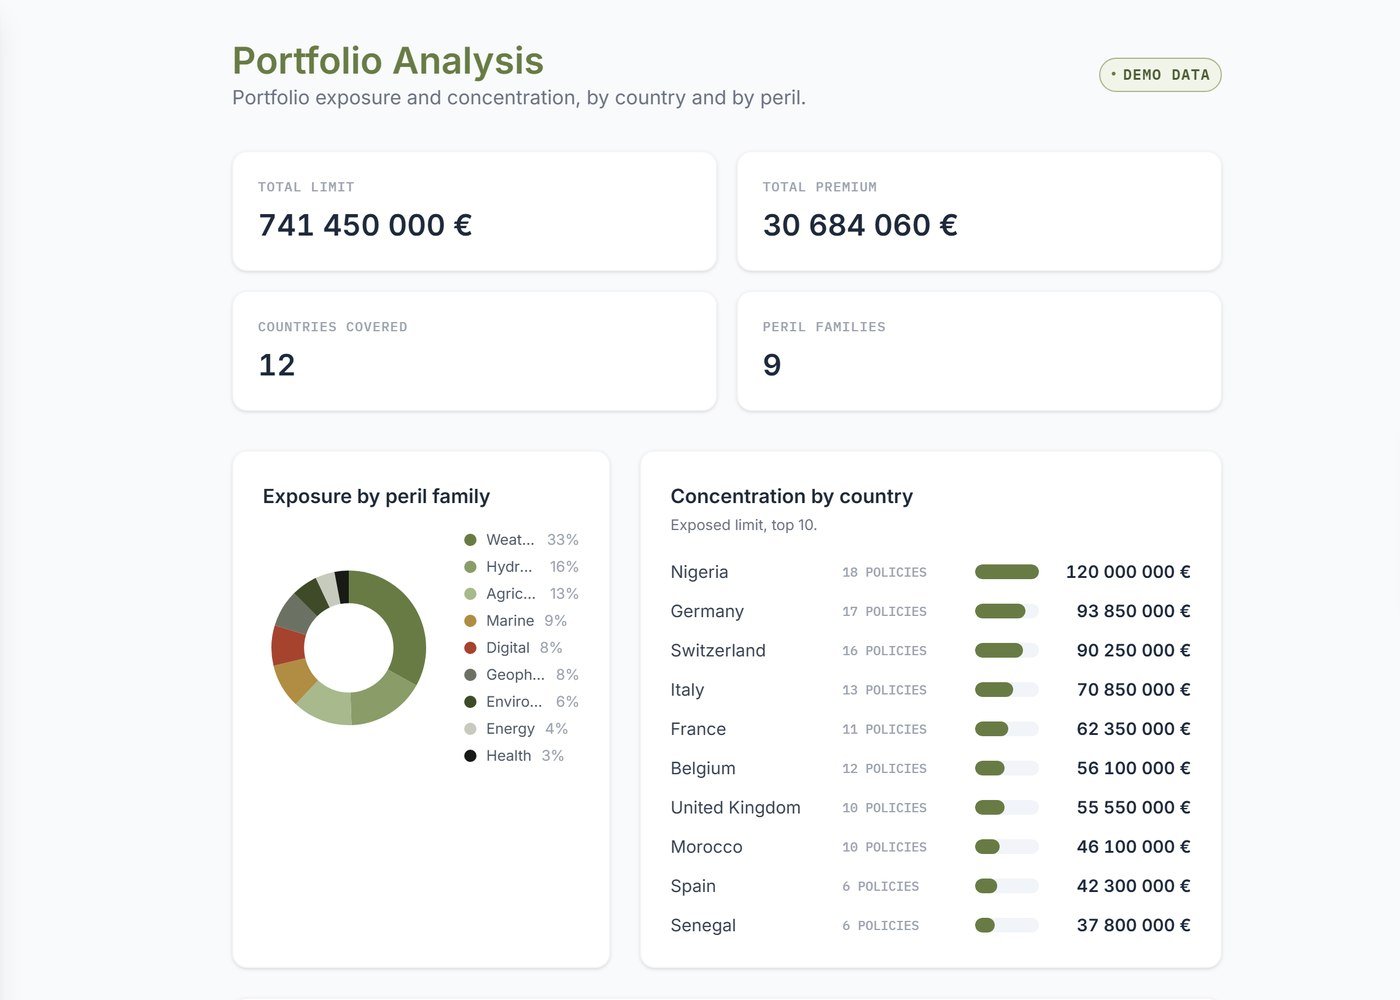
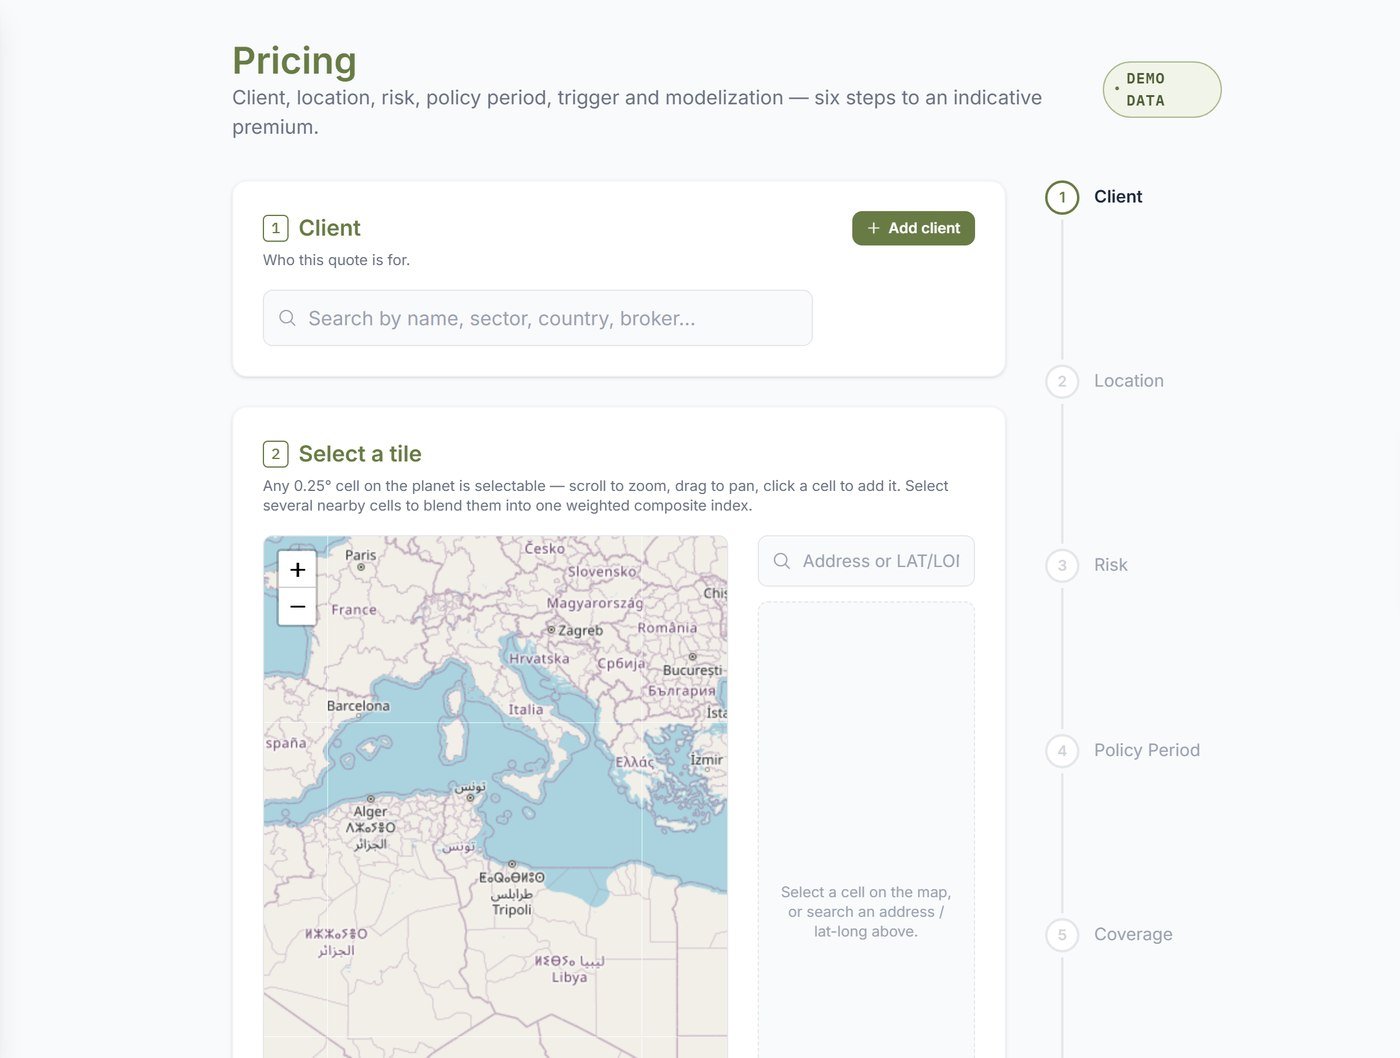
More inside the platform
Built for underwriters — and for integration.
A closer look at four screens from the platform: automated claims monitoring, reinsurance panel capacity, the data backbone behind every price, and the API that lets partners plug straight in.
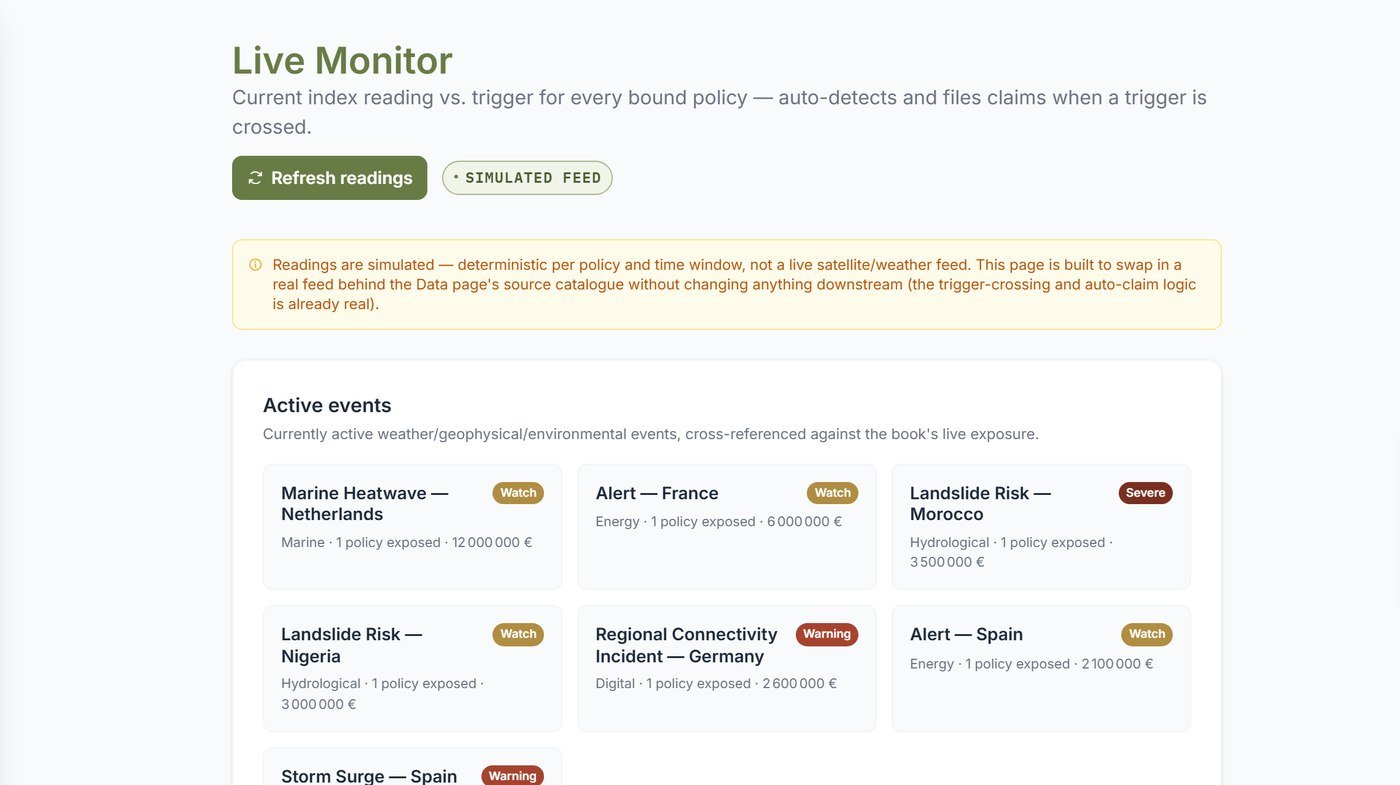
Claims that file themselves
Every bound policy is checked against its trigger continuously. The moment an index crosses the line, the claim is detected and filed automatically — before anyone opens a ticket.
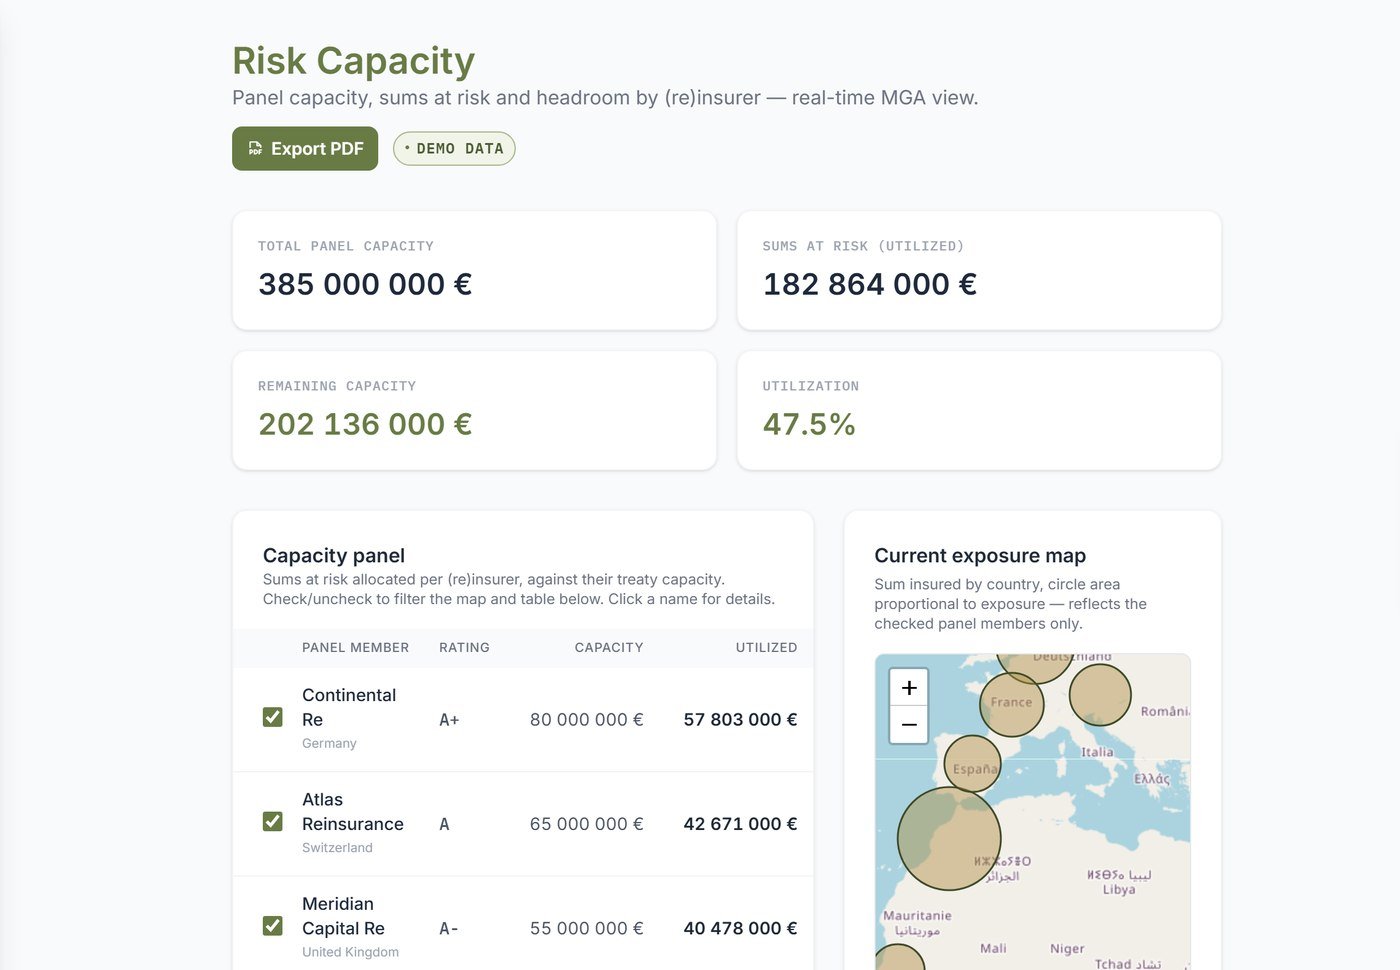
Panel capacity, in real time
Sums at risk and remaining headroom across the full (re)insurance panel, member by member, with exposure mapped geographically as the book fills up.
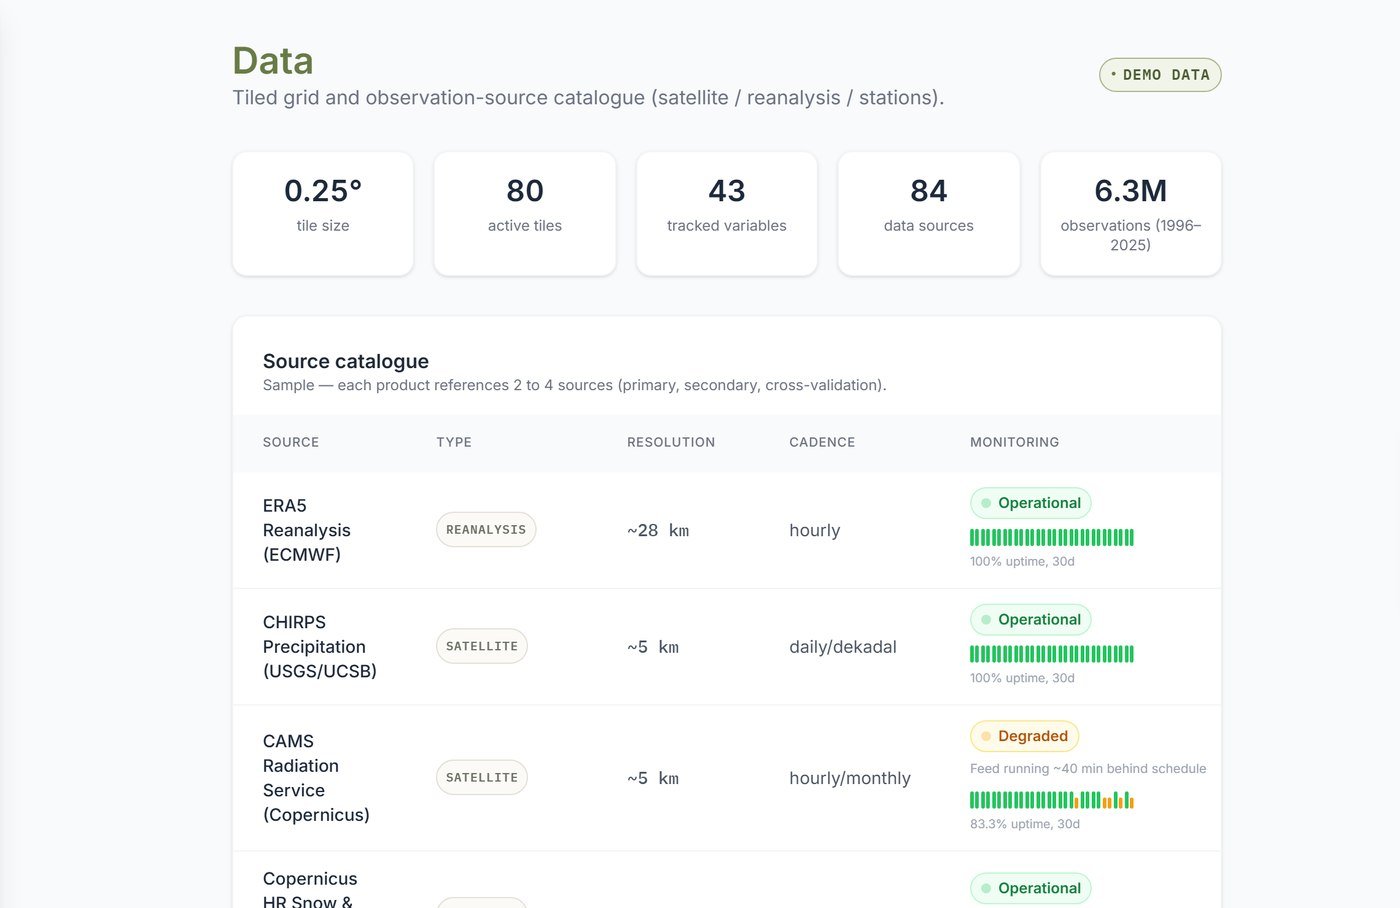
Grounded in real climate data
Pricing runs on a live tile grid — dozens of tracked variables and monitored sources including ERA5, CHIRPS and Copernicus — not hand-picked numbers.
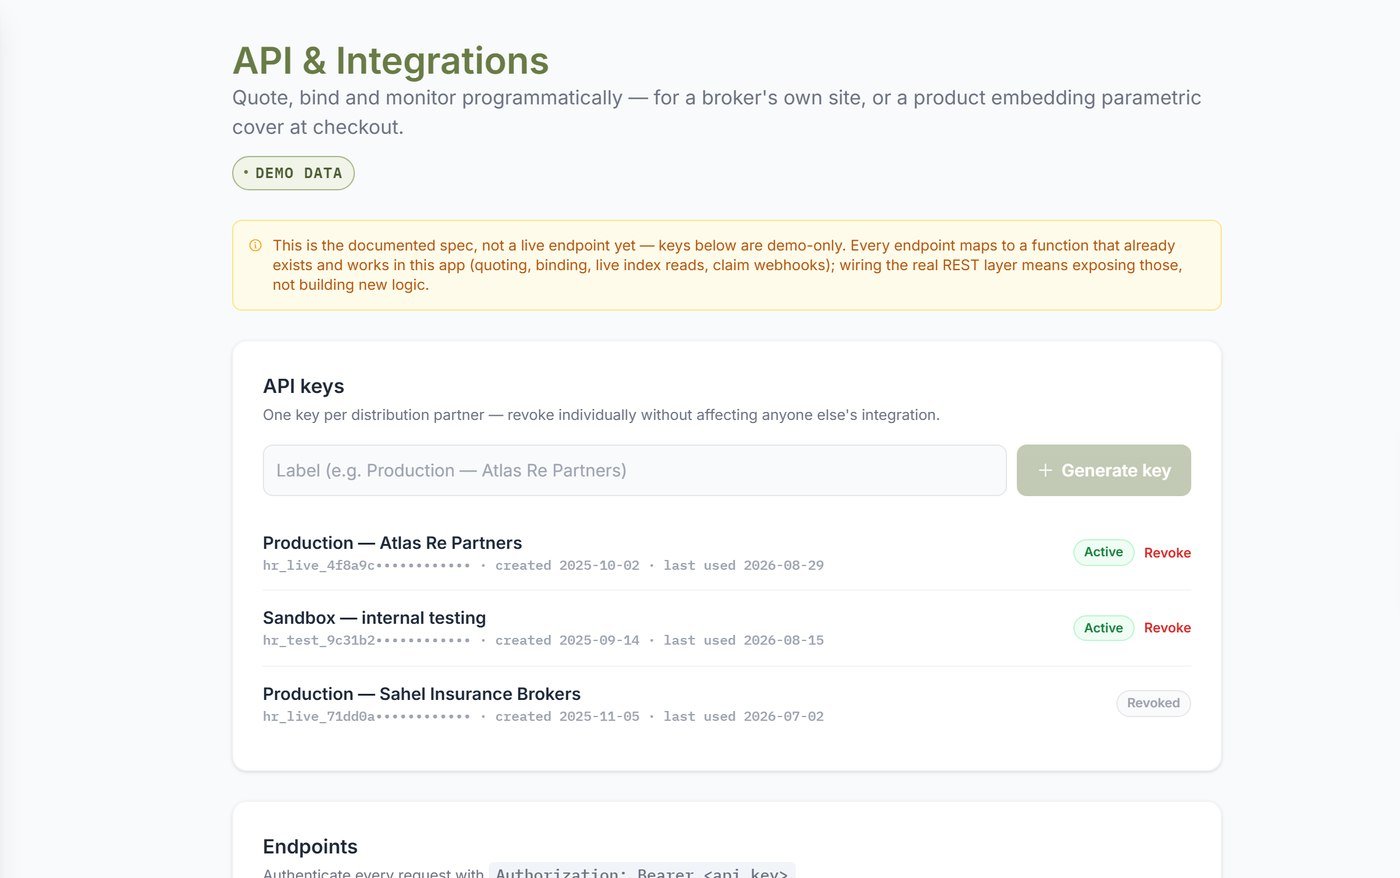
Built to plug in
Quote, bind and monitor programmatically. Every endpoint maps to a function already running in the platform — the same engine Pricing runs on.
Risk Quotation & Underwriting Reports
For any location and peril, the engine turns satellite, geospatial and historical climate data into a complete indicative underwriting report — risk score, frequency, severity, volatility, expected loss and premium.
Risk Score
A 0–100 composite score benchmarking the location and peril against our global exposure library.
Frequency & Severity
Expected annual event frequency and average severity, derived from decades of historical index data.
Volatility
Year-on-year variability of the underlying index — a key driver of pricing loadings.
Expected Loss
Modelled payout under the proposed trigger, before loadings and expenses.
Indicative Premium
Risk-adjusted premium and rate on line, ready to structure into a binder.
Example — Drought Cover, Alsace, France
Trigger: -1.2 SPI (Standardised Precipitation Index) over 3 consecutive months · Notional: €2,000,000
36-month illustrative index history for the selected tile:
Indicative Underwriting Output
Rate on line: 1.76% · Loading: 1.6× expected loss, reflecting model uncertainty and portfolio correlation.
Every quotation ships with a full underwriting report
- Peril & parametric trigger definition
- Data source, methodology & grid resolution
- 36-month historical index series
- Risk score & percentile ranking
- Frequency, severity & volatility breakdown
- Expected loss, loadings & indicative premium
Geographic & Risk Correlation
The engine measures how risks move together — both across locations for the same peril, and across different perils at the same location — the foundation of a diversified, capital-efficient book.
Example — Smoothing a reinsurer's book in Alsace
A reinsurer underwrites Drought risk in Alsace, France for €2.0M notional. On its own, this single-peril position carries the full volatility of the drought index. The engine tests candidate perils at the same location and finds that Flood risk is only weakly correlated with drought there (ρ = -0.18) — adding it smooths the combined portfolio rather than concentrating it.
Drought only
+ Flood, same location (ρ = -0.18)
Diversification ratio improves from 1.00 to 1.31 — the same €2.0M of exposure now carries meaningfully less tail risk, without moving to a new territory.
Cross-Location Correlation — Drought
Correlation of the drought index across six illustrative tiles worldwide.
Cross-Peril Correlation — Alsace
How different perils move together at the same location — the mechanism behind the example above.
Portfolio Re-Analysis — Are You Under-Priced?
The engine re-runs an existing book of parametric positions through refreshed historical data and updated frequency/severity assumptions ahead of renewal — surfacing pricing drift before it erodes margin.
Portfolio 10 parametric positions
| Position | Peril | Notional | Current Net Premium | Re-estimated Net Premium | Gap | |
|---|---|---|---|---|---|---|
| Agri Co-op — Mediterranean | Drought | €2,400,000 | €38,400 | €52,300 | +36% | Under-priced |
| Irrigation — N. India | Drought | €1,800,000 | €27,000 | €29,800 | +10% | In line |
| Solar Farm — W. Europe | Solar Irradiance Loss | €5,100,000 | €76,500 | €104,600 | +37% | Under-priced |
| Solar Farm — S. China | Solar Irradiance Loss | €3,600,000 | €54,000 | €61,300 | +14% | Under-priced |
| Aquaculture — S. India | Sea Surface Temperature | €900,000 | €16,200 | €17,100 | +6% | In line |
| Coral Reef — Indian Ocean | Sea Surface Temperature | €1,500,000 | €27,000 | €39,200 | +45% | Under-priced |
| Ski Resort — Japan | Snowfall | €2,100,000 | €31,500 | €33,900 | +8% | In line |
| Power Grid — Scandinavia | Snowfall | €3,300,000 | €49,500 | €68,800 | +39% | Under-priced |
| Vineyard — California | Drought | €1,200,000 | €19,200 | €24,700 | +29% | Under-priced |
| Solar Farm — C. Asia | Solar Irradiance Loss | €2,700,000 | €40,500 | €44,900 | +11% | Under-priced |
Repricing Recap
7 of 10 positions are priced more than 10% below the refreshed model estimate — most concentrated in Solar Irradiance Loss and Snowfall, where historical volatility has increased since the book was last priced.
Diversification Analysis — Summary
Cross-correlation across all portfolio positions, regardless of peril.
The diversification ratio compares the sum of individual risks to the portfolio's actual volatility once correlation is accounted for. HHI < 0.15 indicates a well-spread book; > 0.25 signals meaningful concentration on a few tiles or perils — here, on Solar and Snowfall.
Risk Intelligence Recommendations
The recommendation engine continuously cross-references the existing book's tile and peril concentration — as computed in Module 03 — against a global library of candidate exposures. For each candidate, it estimates the expected correlation with current positions using the same correlation modelling as Module 02, then simulates the resulting change in portfolio volatility and concentration (HHI). Candidates are ranked by their diversification impact and risk-adjusted attractiveness, so underwriters see where the next unit of capacity does the most good — not just where the next enquiry happens to come from.
Northern Spain — Drought (Rainfall Index)
Based on your existing portfolio, Northern Spain could provide an attractive diversification profile relative to your current Mediterranean and Indian drought exposures.
- Expected Correlation
- 0.06
- Diversification Impact
- +0.14 ratio
- Risk / Return
- Moderate / Attractive
Portfolio impact: Lowers tile HHI
Coastal Vietnam — Wind / Typhoon
Wind exposure in Southeast Asia is largely uncorrelated with your existing solar and drought positions, and would introduce a new peril category to the book.
- Expected Correlation
- 0.02
- Diversification Impact
- +0.19 ratio
- Risk / Return
- Higher / Attractive
Portfolio impact: Lowers peril HHI
Andes Region, Peru — Solar Irradiance
A Southern Hemisphere solar position would offset seasonal correlation currently concentrated in Western Europe and Southern China.
- Expected Correlation
- 0.11
- Diversification Impact
- +0.08 ratio
- Risk / Return
- Moderate / Balanced
Portfolio impact: Improves seasonal spread
From data to risk intelligence
Data becomes actionable insurance intelligence.
Data
Satellite, geospatial & historical climate data
Modelling
Statistical & parametric risk models
Risk Intelligence
Correlation, concentration & diversification
Pricing
Indicative burning-cost & risk-adjusted premium
Portfolio Optimisation
Diversification & concentration management
See the platform on your own portfolio.
Our team can walk you through a live working session using your own exposures and risk appetite.